The tidal stream atlas, and an EP
Find the atlas page for the coming hour, scale the rate for today, and lay an EP an hour ahead on the paper chart.
- Phase 2: Publications and the chart table
- 2 steps on the bridge
- 3 oral questions
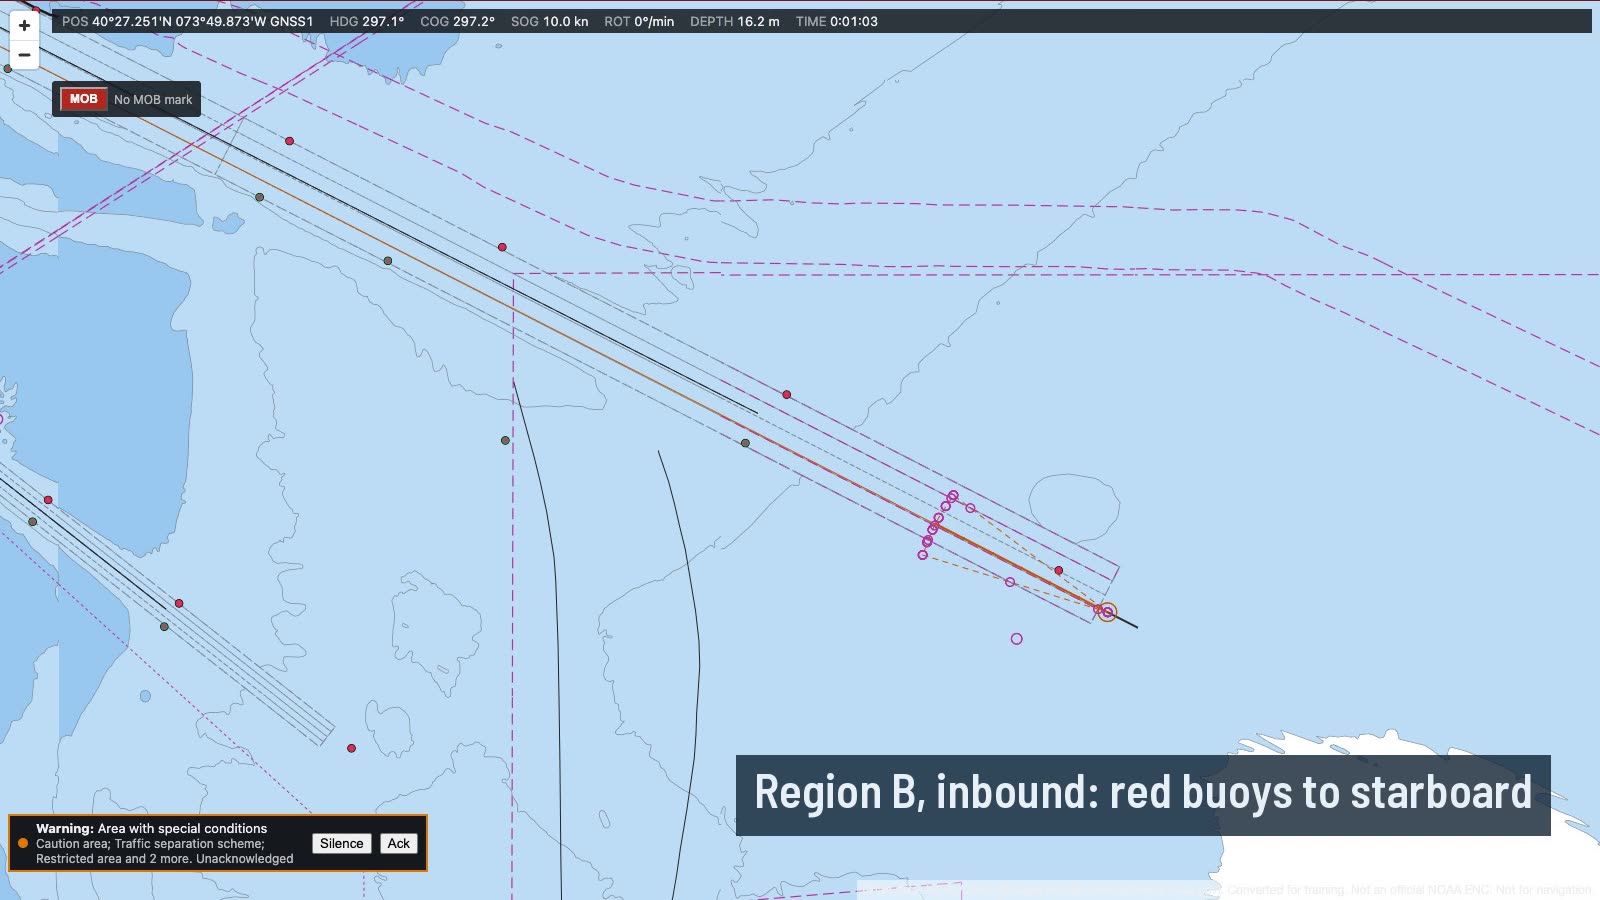
What you do on the bridge
- Plot a fix
- An EP from the atlas
The oral questions, and what a good answer covers
The key points are in our own words. In the course, these questions come once you have done the job.
How do you use a tidal stream atlas?Often asked
A good answer covers:
- Find the time of HW at the reference port the atlas is based on, for the day
- Pick the page for the hour you want: each page covers about half an hour either side of its time
- Read the set from the arrow, and the rates at springs and neaps from the figures beside it, usually in tenths of a knot
- Interpolate the rate for the day from the day's range at the reference port against the mean spring and neap ranges
- Use the arrow nearest your position, and allow for the stream changing over the hours you are working
Show me on the bridgeTide tables, then Tidal stream atlas: the page for two hours before HW Sandy Hook.
What is the difference between tidal diamonds and a tidal stream atlas, and which would you use?
A good answer covers:
- Diamonds give the stream at one charted point, in a table on the chart, hour by hour from HW at a reference port
- An atlas shows the stream over a whole area, one page an hour, so you can see how it changes along the passage
- Both are predictions: wind, surge and river flow change the real stream, so check it with fixes
What is the difference between a DR and an EP?
A good answer covers:
- A DR is run on from a fix by course and speed through the water only
- An EP also allows for the tidal stream (and leeway): set and drift for the time run
- An EP is the best position you have without a fix, but it is only as good as the stream and the speed used
- Mark them with their own symbols and times on the chart, and confirm with a fix as soon as you can
How the lesson runs
The tutor's narration from the lesson, step by step. On the bridge, each control lights up as it is named.
Brief
Southbound off the Jersey shore at ten knots, heading one nine zero. High water Sandy Hook is in two and a half hours, and it's between springs and neaps.
You'll lay an estimated position an hour ahead on the paper chart, using the tidal stream atlas for the stream.
Plot a fix
At the chart table, plot the GNSS position on the largest-scale chart. That is where the EP starts.
An EP from the atlas
Open the tide tables, then the tidal stream atlas. The coming hour is centred on two hours before high water, so turn to that page and read the arrow nearest you.
The figures are the spring and neap rates in tenths of a knot. Today's range at Sandy Hook is about two thirds of the way from neaps to springs, so take the rate about two thirds of the way between them.
Then lay the EP an hour ahead from the fix: one nine zero at ten knots, with that set and drift.
Do it, then explain it.
Read the answers here for free. With a pass you work this lesson on the bridge, then practise its questions and mark your answers.